Simple guide to the website
- the Classifications page provides links to spreadsheets showing the classification for each group of countries covered, by year, 1974-2017
- the Countries page provides links to the ‘individual country details’ that provide a rationale for the classification in each case, with references to the main IMF and other sources used
- the Visualisations page provides a link to a range of visualisations which users can generate for themselves, showing the evolution over time of the use of different types of monetary policy framework, weighted by the number of countries in each category, or by the GDP of the countries in each category, or by the population of the countries in each category
What it’s all about
If you’re interested in thinking about how and why countries’ choices of different monetary policy frameworks – monetary targeting, inflation targeting, ad hoc discretion, etc – have changed over time, it’s actually not that easy to find good measures of that evolution. And if you’re interested in investigating how the prior choice of different frameworks has affected economic performance, either in general or, for example, in response to the Global Financial Crisis, then this is also difficult in the absence of such measures.
What this website presents is a new and comprehensive classification of monetary policy frameworks which does the following:
- it brings together domestic monetary policy with exchange rate policy: the two are obviously related, since how a country arranges its exchange rate affects the monetary policy choices open to it, but classifications of exchange rate regimes largely (not entirely) ignore the monetary policy that accompanies those regimes
- it takes account of what the monetary authorities have done, as well as what they have said: it’s all very well announcing a target for money or inflation, but it’s important to see whether that target is met
This kind of information, especially for earlier years (before central banks operated websites and committed themselves to some minimum transparency), is hard to come by. But there is a source, or set of sources, which turns out to be very helpful: the IMF holds regular consultations (typically once a year or every two years) with each of its members on their exchange rate, monetary and other macro policies, and the reports produced contain a wide range of relevant information. The classification here relies heavily on a close reading of these sources (the relevant parts of some 50 documents for each country over the 41 years so far covered), sometimes supplemented by longer-term perspectives in papers by central bank or academic economists.
On this basis we start by distinguishing between different target variables (exchange rate, money, inflation), different types of target (narrow or wide, stationary or converging), different types of discretion (from incoherent to well-ordered), and that gives us 32 different monetary frameworks. If we then graph the proportion of countries/currency areas (out of 26 ‘advanced’ countries, plus the euro area, and 33 emerging economies) which use each framework we get this:
Figure 1: Incidence of monetary policy frameworks over time, advanced and emerging economies, full menu of frameworks
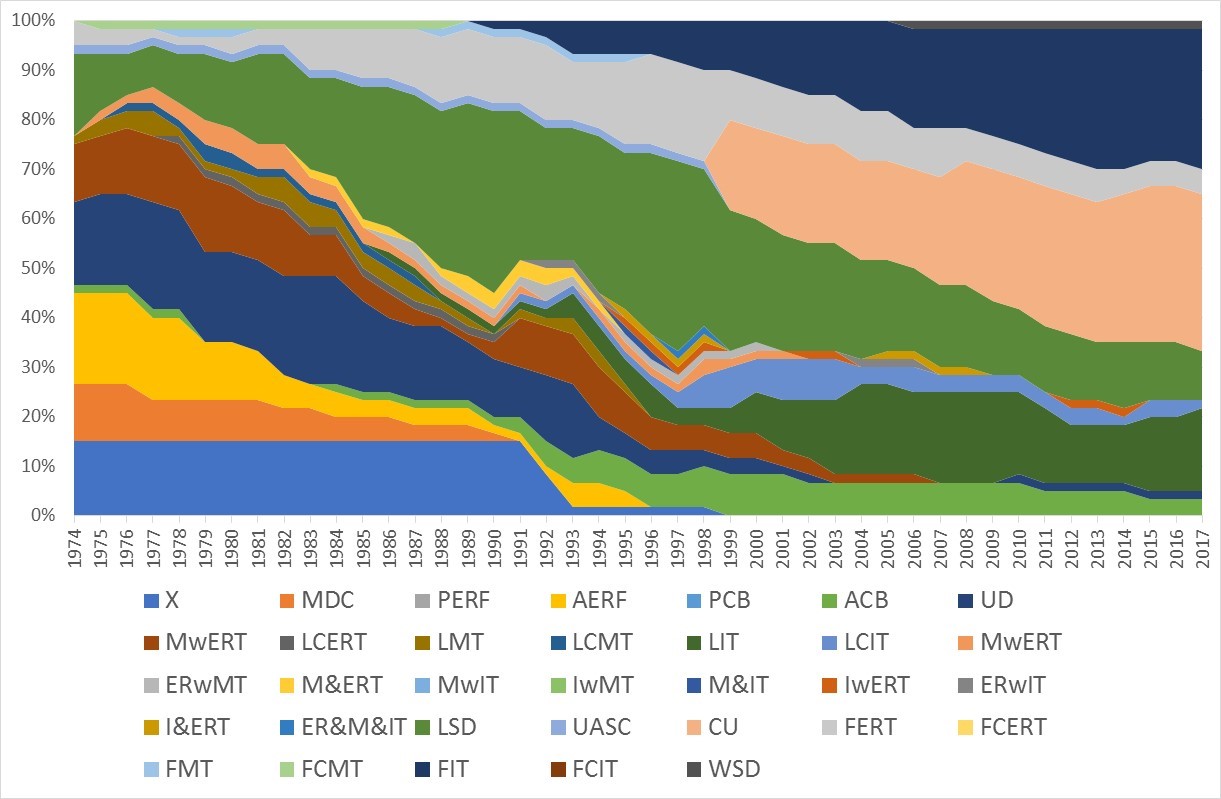
This figure is quite difficult to get much out of (even when you know the acronyms for the frameworks), and 32 frameworks is too many for many purposes (for example, econometric analysis of the association between the frameworks and inflation or growth).
So we then aggregate the frameworks together, along two separate dimensions:
- first, the variable which is being targeted – money, exchange, inflation, some particular combination or some less clear and possibly changing combination of these and other possible objectives
- and second, the degree of control of overall monetary conditions, which reflects how different frameworks (with, in particular, different types of financial infrastructure) offer different degrees of control of monetary conditions.
There may also be some other useful aggregations, which the user can work out for herself.
On that basis we get the following:
Figure 2: Incidence of monetary frameworks, advanced and emerging economies, target variable aggregation:

Figure 3: Incidence of monetary frameworks, advanced and emerging economies, degree of monetary control aggregation:

The two major trends revealed by the figures are
- over time countries have moved towards frameworks that target inflation rather than any other variable
- over time they have moved towards frameworks that involve more sophisticated financial and monetary infrastructure which allows the monetary authorities to exercise more precise monetary control.
The material on this website presents the details lying behind all this, and more. In particular, it includes a working paper which sets out how the classification is implemented; pages for each country covered showing how they have been classified in different years; and the data from the classification, with graphs that enable it to be examined from different perspectives.
Over time, the intention is that more material will be made available here, including updates of the classifications themselves, extensions to developing countries (by regions, up to an eventual total of 170 or so countries), and papers (or links to papers) that make use of the classification in different investigations.
You can download the working paper here.
If you would like to be notified of new updates as this project develops, please sign up below.
